



In the web UI, you can rapidly filter your data by neighbourhoods and display it in plots, charts, or tables.
Neighbourhoods are pre-defined volumes of space such as a level, a stope, a drive, or a shaft area. They can also be used to filter the data in the 3D viewer.

Previous tips can be found under the Software tip category in the News section and in the Archives section of our website.
Latest news

15 tips in 15 minutes – Geoscience ANALYST Free Viewer
Past event, view here or on our YouTube channel...

Default data colour settings
In Geoscience ANALYST you can set a default colour table and colour mapping transformation function. This way, when you import or create new data, it will be coloured by default.

Linking cursors
In Geoscience ANALYST you can use the Link Cursors button to helps to track the location of your cursor across multiple Viewports...

Searching in the objects tree
Having trouble finding one object out of hundreds in Geoscience ANALYST? Try searching your Objects panel (Ctrl+F)...
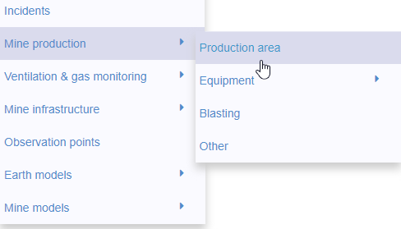
New mine production theme
In Geoscience INTEGRATOR, version 3.2 has a new theme called Production area. It’s designed for stope, mining room, or drawpoint data...

Deep Learning as an alternative to downward continuation filters for structural interpretation
Jean-Philippe Paiement proposes an alternative approach to the commonly used downward continuation filters used in the industry...

Rock reclassification editor
In GOCAD Mining Suite, you can simplify logging codes for modelling projects and data management using the Rock reclassification editor...

Coordinate display area
In Geoscience ANALYST you can get real-time feedback on the XYZ coordinates corresponding to the...
..

Using ioGAS in Geoscience ANALYST Pro – Virtual Lecture
Past event, recording available here...

Meet Polyanna Rowe, PhD
This release includes enhancements to several existing importers and exporters for extended interoperability, and more...

New filter options on the File manager and the Maps/plans/sections
In Geoscience INTEGRATOR, you can now find files quickly by using the new extension, tags and uploaded by filters...

Custom discrete colour scales
Geoscience INTEGRATOR allows you to build and display custom colour scales when making a scatter plot or...