


By default, the Theme drop down menu shows a filtered list of those containing data sets. You can see the full list anytime by clicking Show all themes.

Previous tips can be found under the Software tip category in the News section and in the Archives section of our website.
Latest news

Scripting
In Geoscience ANALYST Pro the Script on Object Property utility in Geoscience ANALYST Pro can be used in a wide variety of geoscientific applications...
Building a greenfields project from public data in Geoscience ANALYST Pro – Virtual Lecture
See recording - Gem shows how Geoscience ANALYTS is a great tool to do exploration without getting your boots dirty...

Importing and visualizing VP Geophysics models
In Geoscience ANALYST v3.1, VP Model objects can now be imported by a simple drag and drop! You can then visualize the model and,...
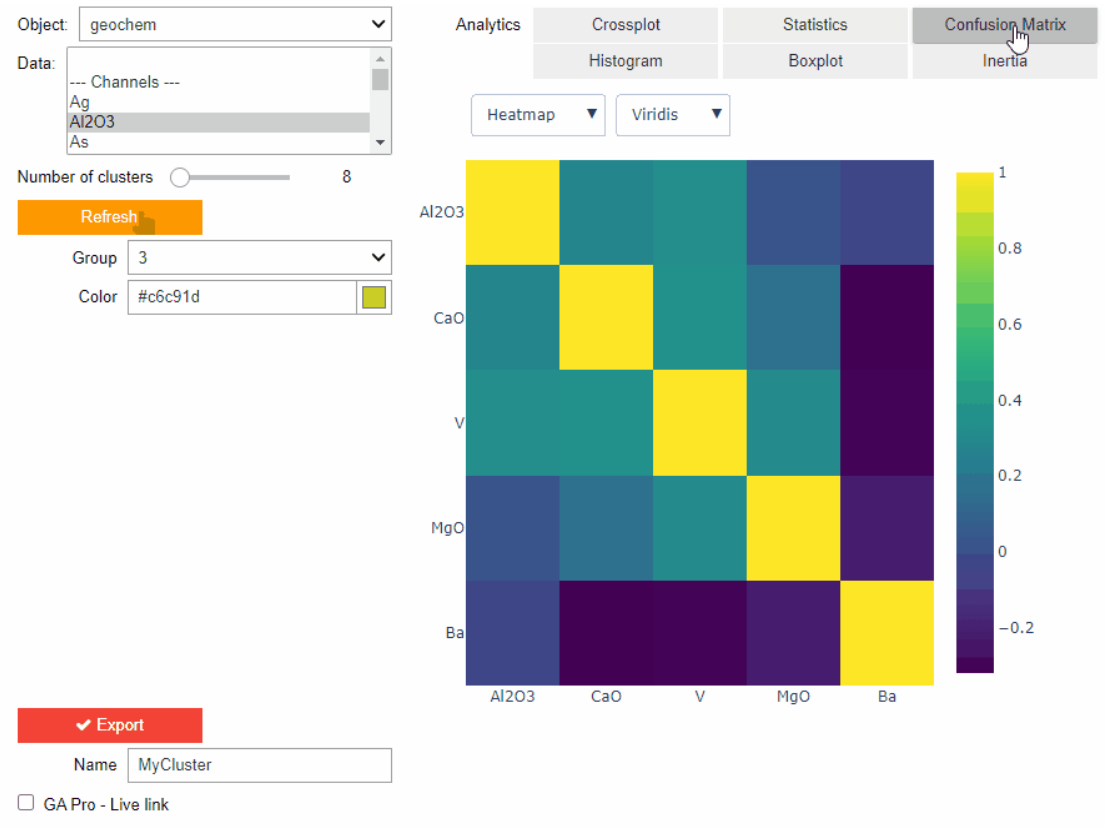
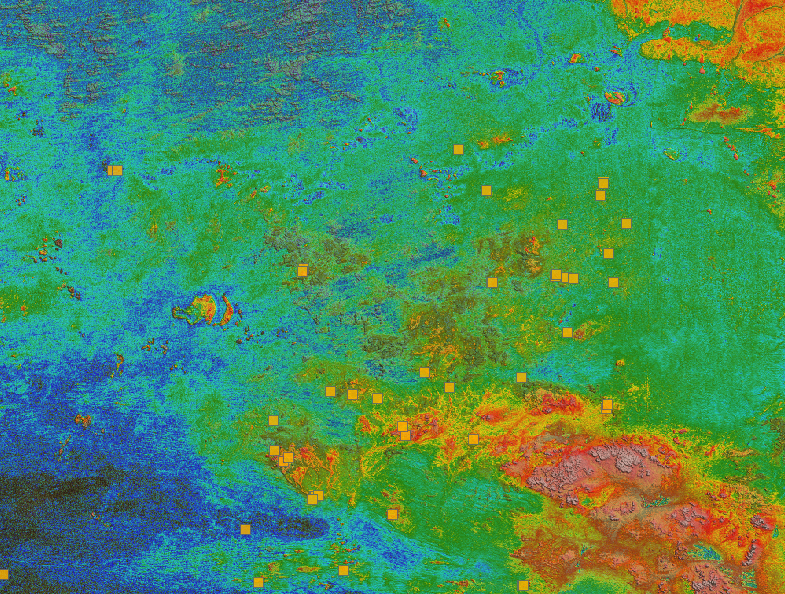
Clustering data stored on geoh5 objects
Past event. View here or on our YouTube channel...

Q&A: Revival Gold Inc.
We discussed Mira Geoscience’s contribution to further understand the Beartrack-Arnett gold project area using modern exploration techniques...

New Visual Parameter – Contours
In Geoscience ANALYST you can visualize contours on 2D grids. Select your data, specify the contour parameters, or change the colour.
..
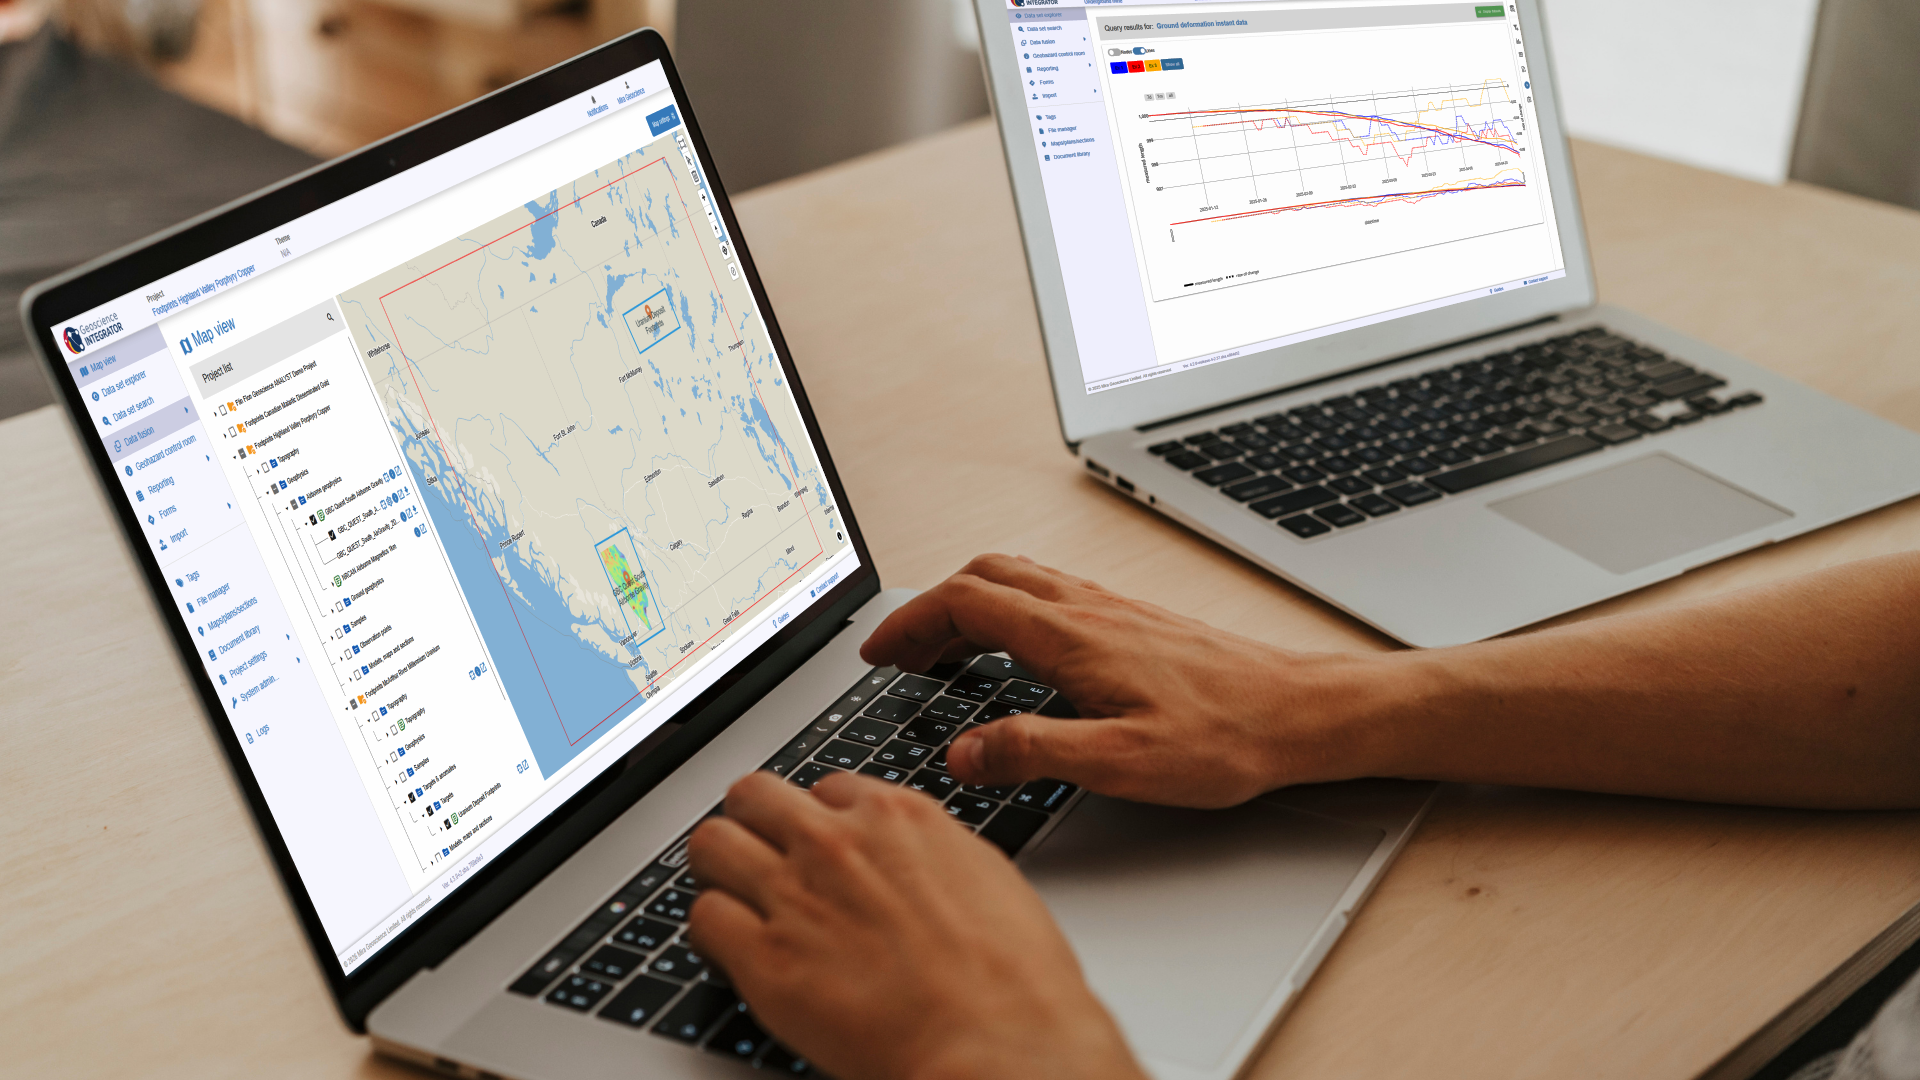
New release – Geoscience INTEGRATOR 4.3
Geoscience INTEGRATOR 4.3 introduces exciting new features to help you manage your data more efficiently and streamline your workflow

Editing property transparency
In GOCAD Mining Suite, when you select a property its transparency can be edited...

Customized list of file types to help filtering your files
In Geoscience INTEGRATOR, on top of using Tags and Data set linking, you can give them a File type from a customizable list...

New importer: 2D SEG-Y
In Geoscience ANALYST you can visualize your block model data by volume in the Visual Parameters panel...
..

Visualize 3D vector properties
In GOCAD Mining Suite the normal of a surface is an example of a 3D vectorial property, where the components of the vector are...

Show and hide
In Geoscience ANALYST you can show and hide everything, individual objects, container groups or drillhole groups...