



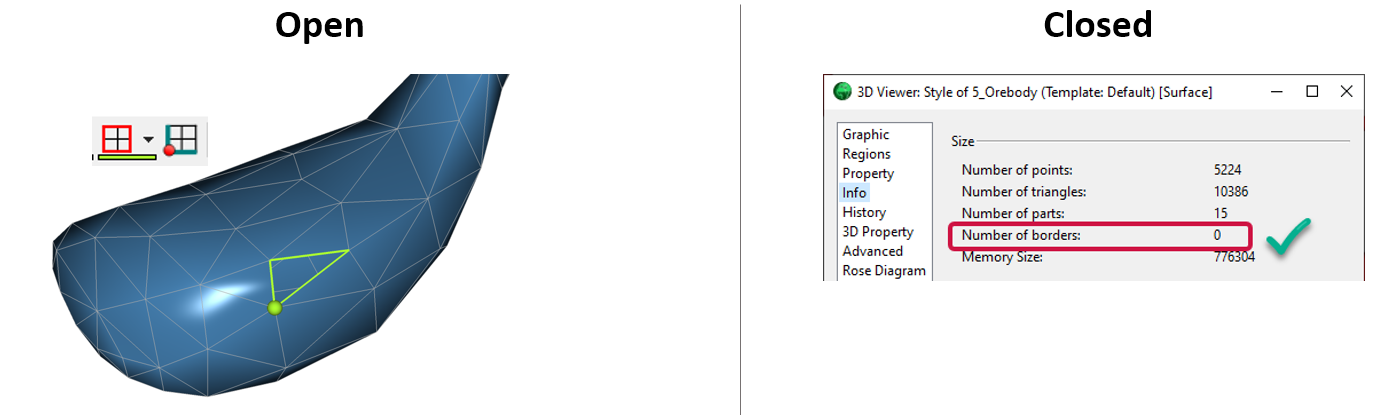
Wondering whether your closed surface is actually closed? Here are a few tips on how to find this key information:
- Verify the number of borders in the surface’s Style Editor > Info. A closed surface will have 0 borders.
- If borders and border extremities are present on the surface, the surface is open. To make these more obvious in the camera, change their color, increase their thickness and size, or create a curve from borders.
- If you are still not sure, try to use the surface in a 3D-GIS Shell query. If the surface is not closed, the query will not be completed, and an error will be reported.
Previous tips can be found under the Software tip category in the News section and in the Archives section of our website.
Latest news

How to run gravity inversions in a geologically driven way
Past event, view here or on our YouTube Channel to see how to run a 3D inversion and forward modelling in Geoscience ANALYST Pro using VPmg...

Women Geoscientists in Canada
We are proud sponsors of WGC, advocates for increased gender balance within geosciences...

Using magnetic susceptibility measurements to define mineral exploration targets
Combining magnetic survey data with measured drillcore susceptibility data greatly increases the resolution and geometrical accuracy of the magnetic inversion...

Depth-to-basement inversion using geometry and homogeneous VPmg inversion
Past event - View here or on our YouTube channel...
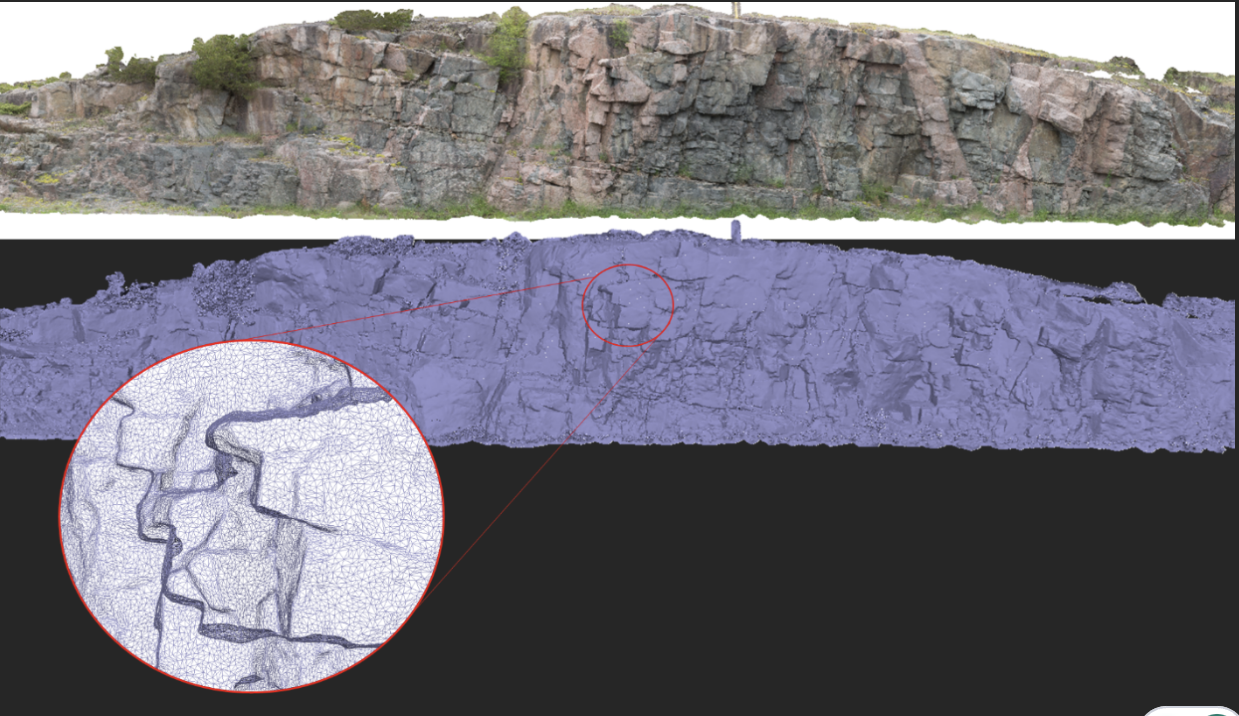
Creating Mappable Surfaces
Capture geological observations quickly, safely, and accurately, both in the field and office with HiveMap...

Editing file settings
In Geoscience INTEGRATOR version 3.4, users will be able to edit their files’ settings...
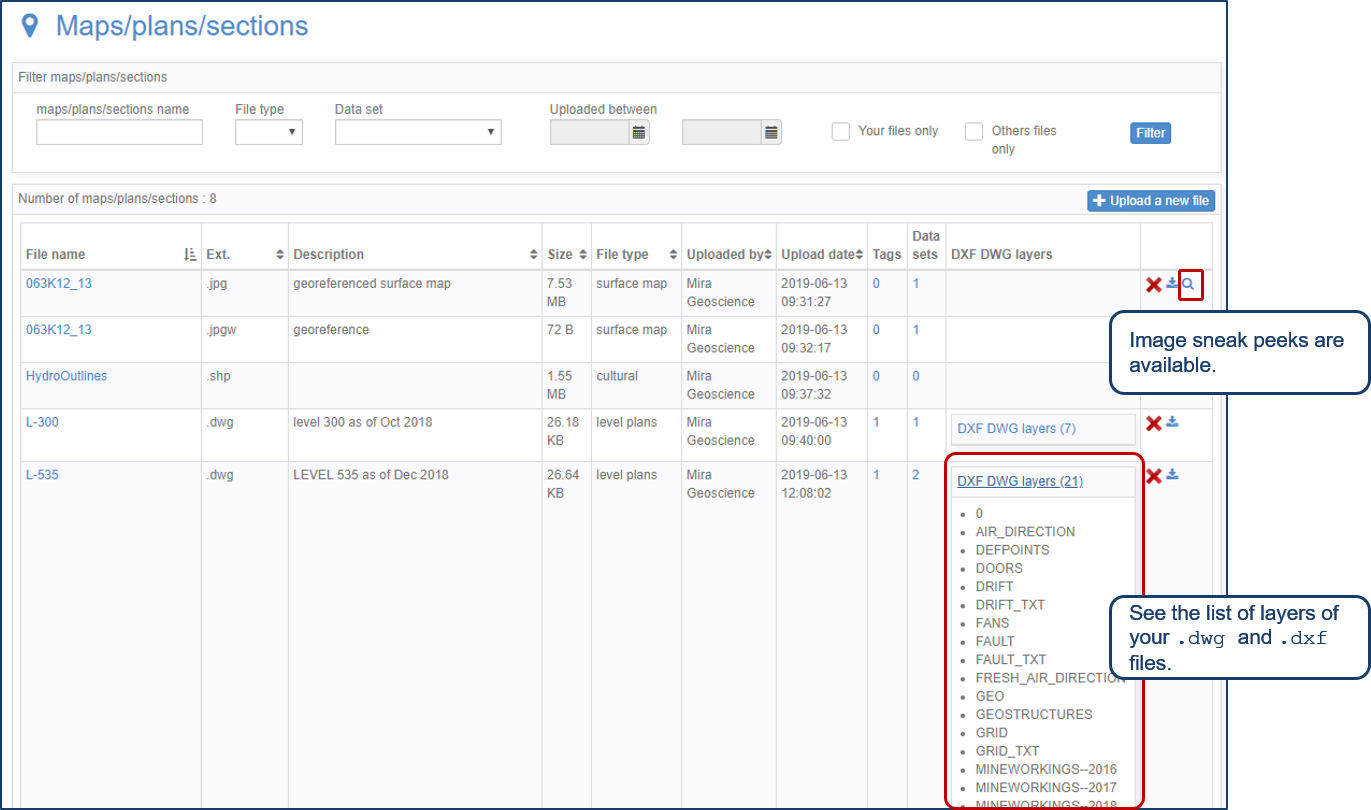
Preview files in the Maps/plans/sections page
See the list of layers of your .dwg and .dxf files. Image sneak peeks are also available...

SimPEG open-source modelling and inversion with Geoscience ANALYST Pro Geophysics
This workshop teaches you to use multiple geophysical datasets and the newest SimPEG tools in Geoscience ANALYST Pro Geophysics.
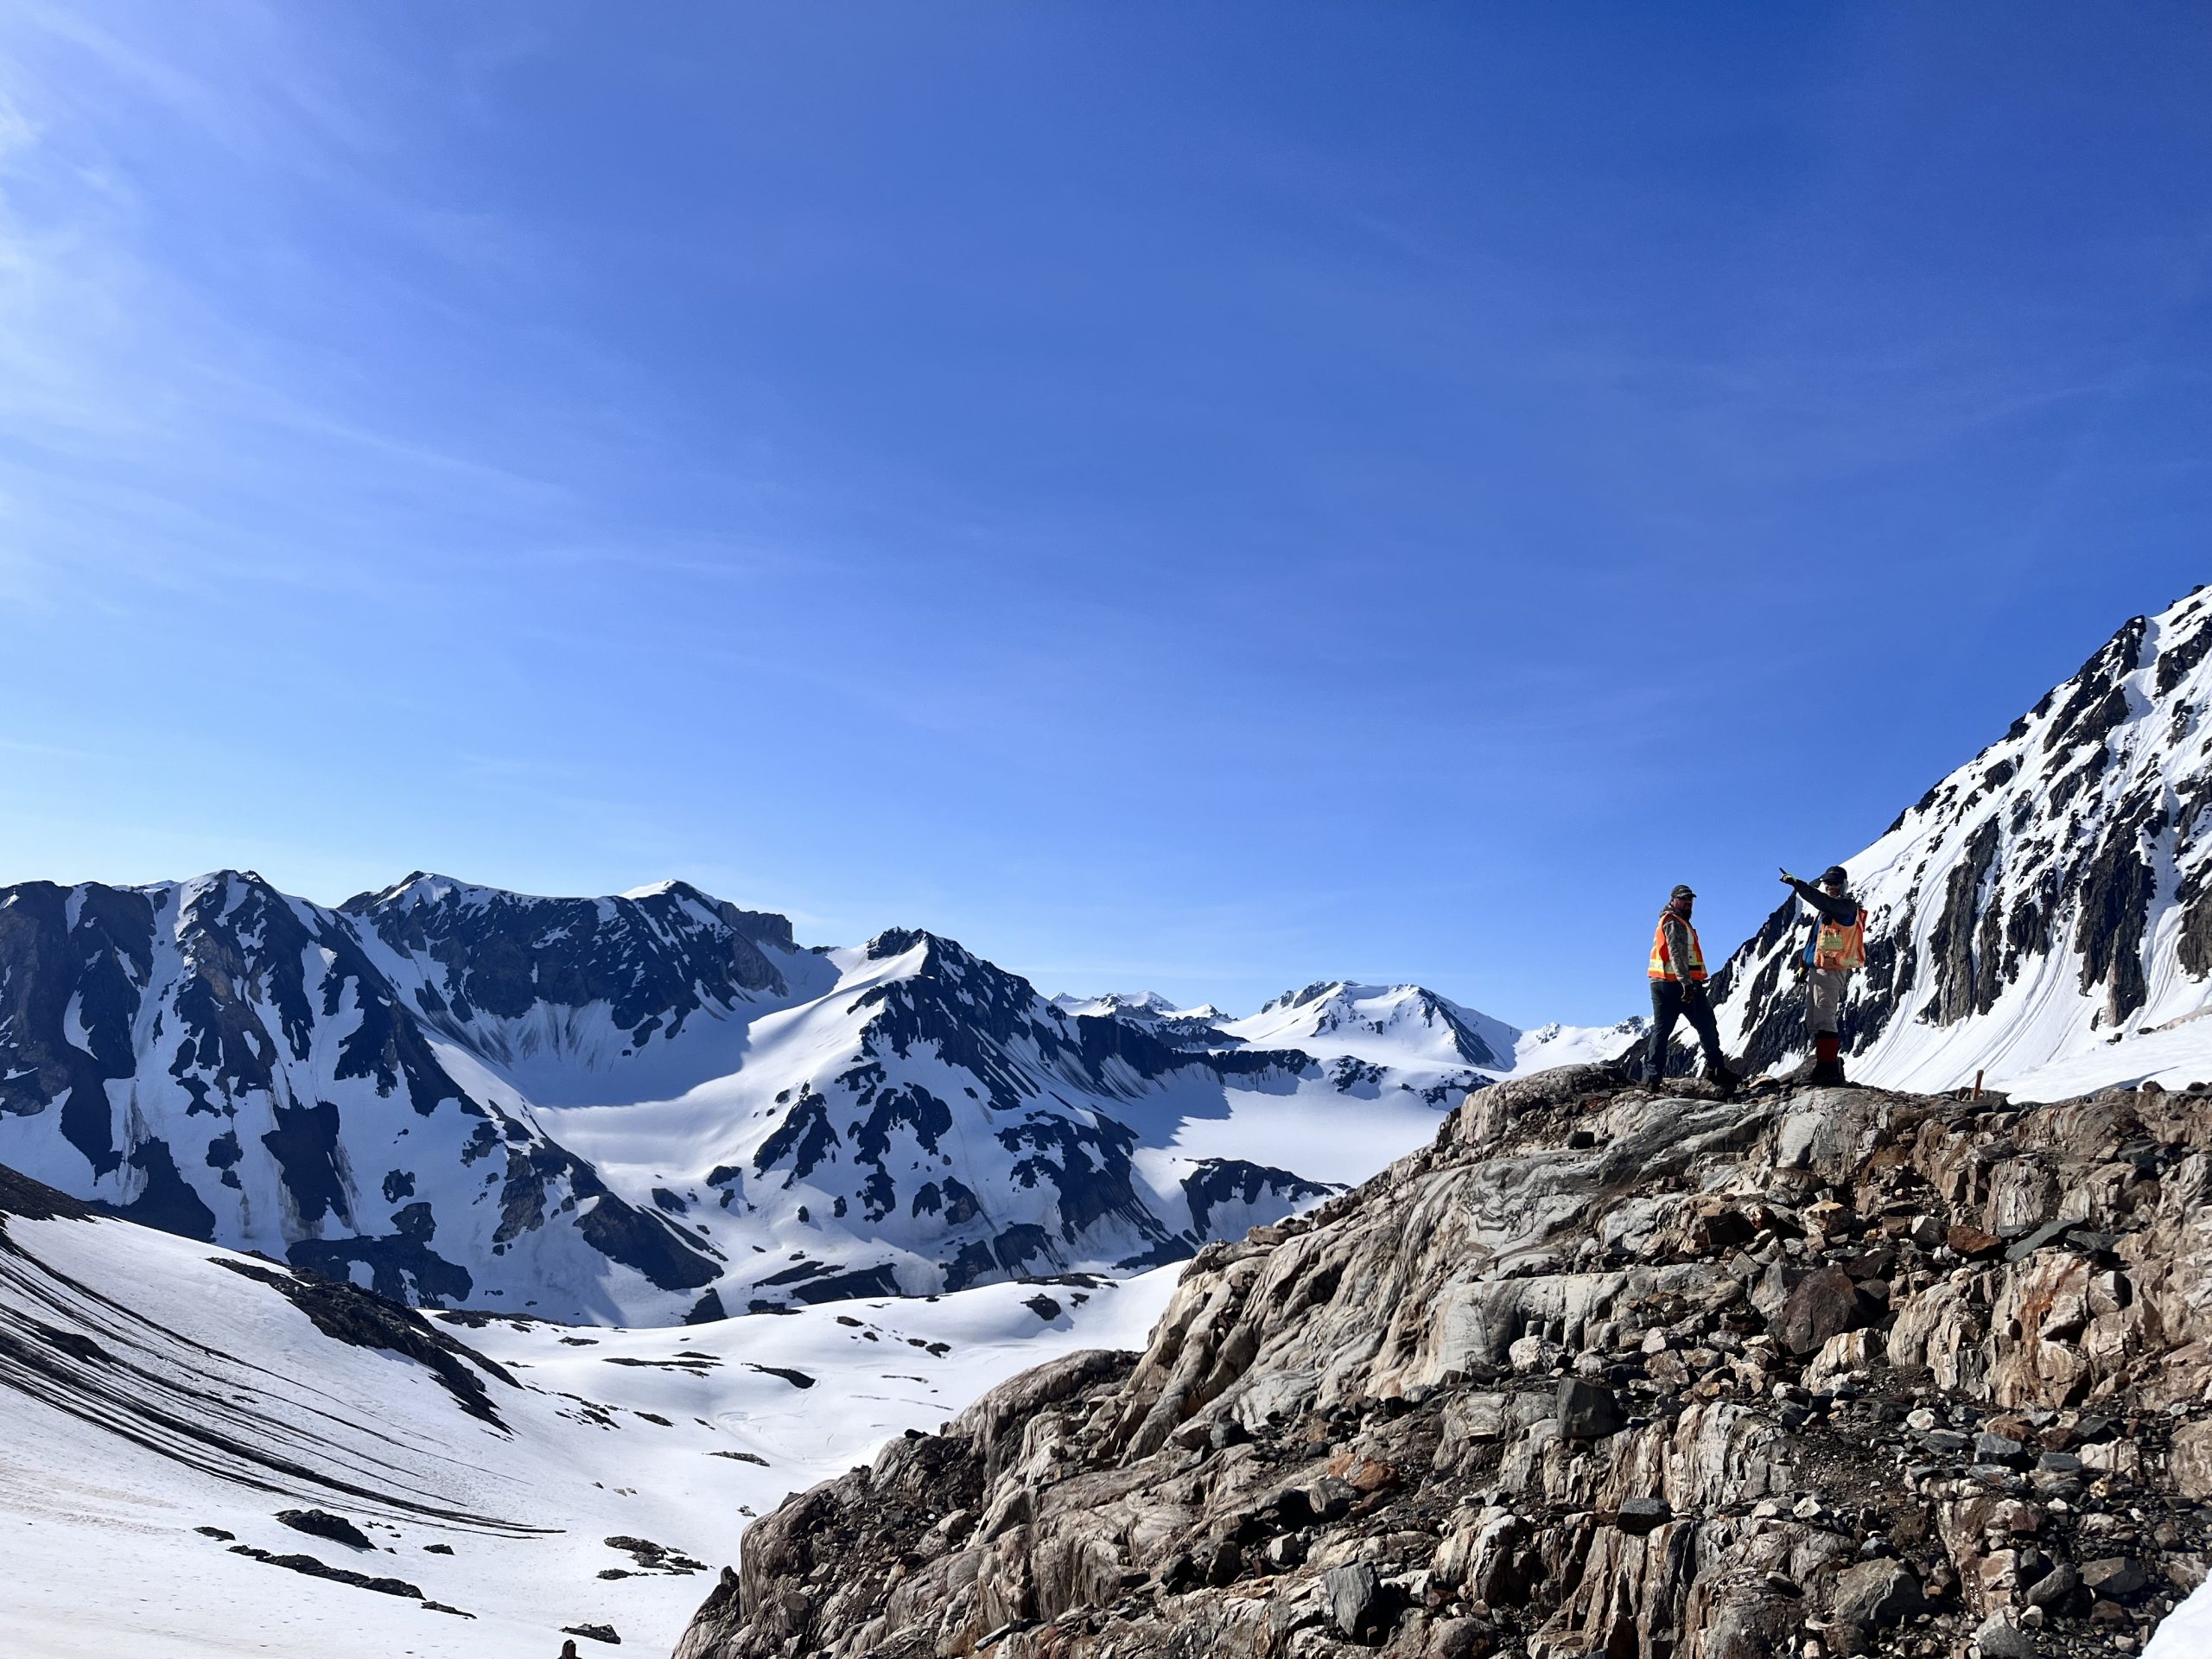
Digital Mapping, The Future!
Capture geological observations quickly, safely, and accurately, both in the field and office with HiveMap...

Free mineral exploration data through Geoscience ANALYST
Past event - view here or on our YouTube channel...

Filtering data by neighbourhood
In the web UI, you can rapidly filter your data by neighbourhoods and display it in plots, charts, or tables.

Rapid and accurate mapping
We explain how automated generation of alteration maps using radiometric data is well-suited to large-footprint mineral systems...