


You can now visualize contours on 2D grids. Select your data, specify the contour parameters, or change the colour.

By default, the anchor is set to the data’s minimum value and the number of contours to 20, from which an interval is calculated to best fit your data. Learn how to visualize contours with this video.
Create curves from these contours with Geoscience ANALYST Pro.
Previous tips can be found under the Software tip category in our Resources page and in our Archives page.
Latest news

Search for data by spatial extent
This video shows you how to search for data from Geoscience INTEGRATOR by spatial extent...

ODBC drillhole import
In Geoscience ANALYST you can import drillholes straight from your ODBC database...

Manual classifications vs Project classifications
In Geoscience INTEGRATOR, There are two ways to create classifications when importing data...

25 years modelling the earth together
Dedicated to driving technological innovation and excellence in the realm of geoscience. Your success is at the heart of everything we do.

Plotting drillhole data
While pencil crayons are still a vital part of geology, Geoscience ANALYST lets you get all your data into 3D in a convenient shareable format...
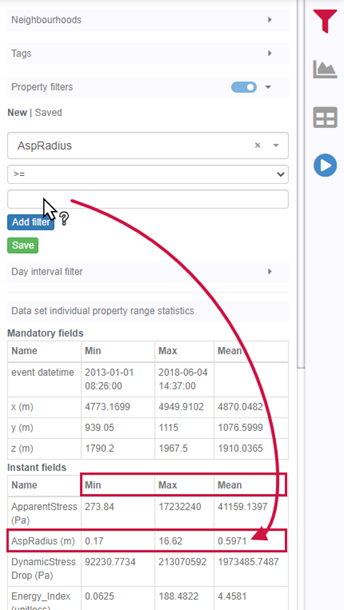
Property value range
In Geoscience INTEGRATOR, You can refer to the range of values in the query panel to apply numeric property filters...

No-data values on import templates
In Geoscience INTEGRATOR, you can prevent importing no-data value strings by providing a general NDV to be applied to all properties of the template...

The value of using structural restoration tools in exploration modelling – Virtual Lecture
Watch recording - Jean-Philippe shows the use of structural restoration tools in GMS as a modelling tool for structurally controlled deposits...

Upload global descriptions
In Geoscience INTEGRATOR, add an editable global description during import to save time and reduce errors...

Sneak peek v19
Emerson-Paradigm released a short video to help users become acquainted with the redesigned interface. Watch this short video ...
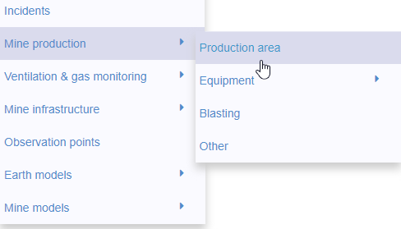
New mine production theme
In Geoscience INTEGRATOR, version 3.2 has a new theme called Production area. It’s designed for stope, mining room, or drawpoint data...

Automatic rotation
In Geoscience ANALYST you can autorotate viewport when presenting your 3D geoscientific data and models...