


There are various ways to filter time-based data. Some examples:
Shifts can be used to show blasts during morning shifts and the Property filter will allow you to select on what day(s).
The Property filters could also be used to display a crossplot of properties of rockburst incidents between selected dates.
Day interval filters could be used to create a histogram of the count of microseismic events that have occurred daily in the last 10 days.
Once you are happy with your filter, you can generate the results in a table or a chart.

Previous tips can be found under the Software tip category in the Resources section and in the Archives section of our website.
Latest news

Save classifications as xml
In GOCAD Mining Suite, Saving complex geological classifications, such as for drillholes, allows you to share them with a colleague or...
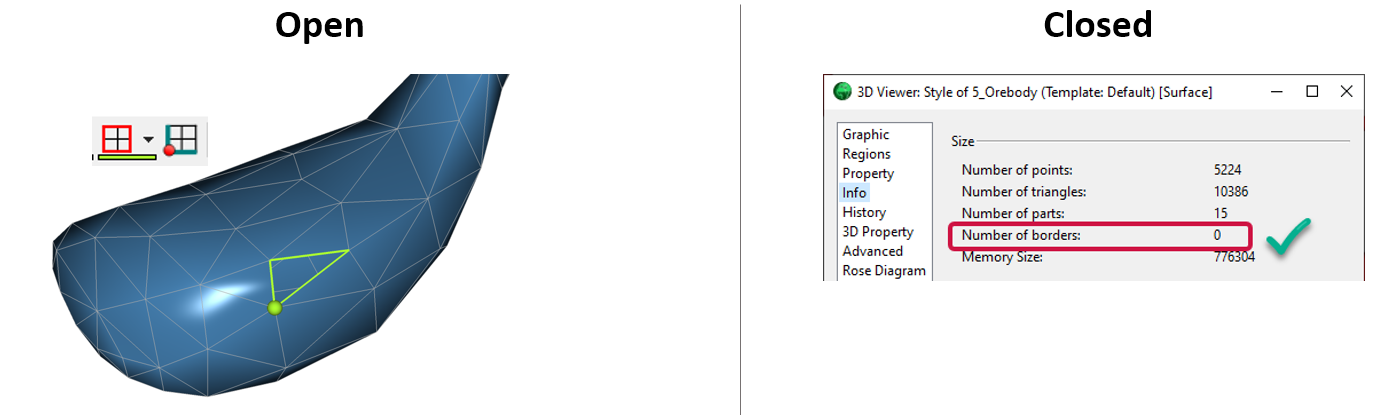
Is the surface opened or closed?
In GOCAD Mining Suite you can easily know if your surface is opened or closed by...

A YouTube Channel about 3D modelling
We have quite a few how-to and tutorial videos lined up on YouTube highlighting our earth modelling, interpretation, and data management software for the construction of plausible geological models.

Bounding boxes in the viewer
Coloured bounding boxes are used to highlight volumes in the Viewport: A purple box surrounds your current selection...

Uploading multiple files
In Geoscience INTEGRATOR, you can upload multiple files in one simple step...

Adding reference images
You can add reference images to mine fusion models and hazard reports in Geoscience INTEGRATOR to better orient yourself visually.
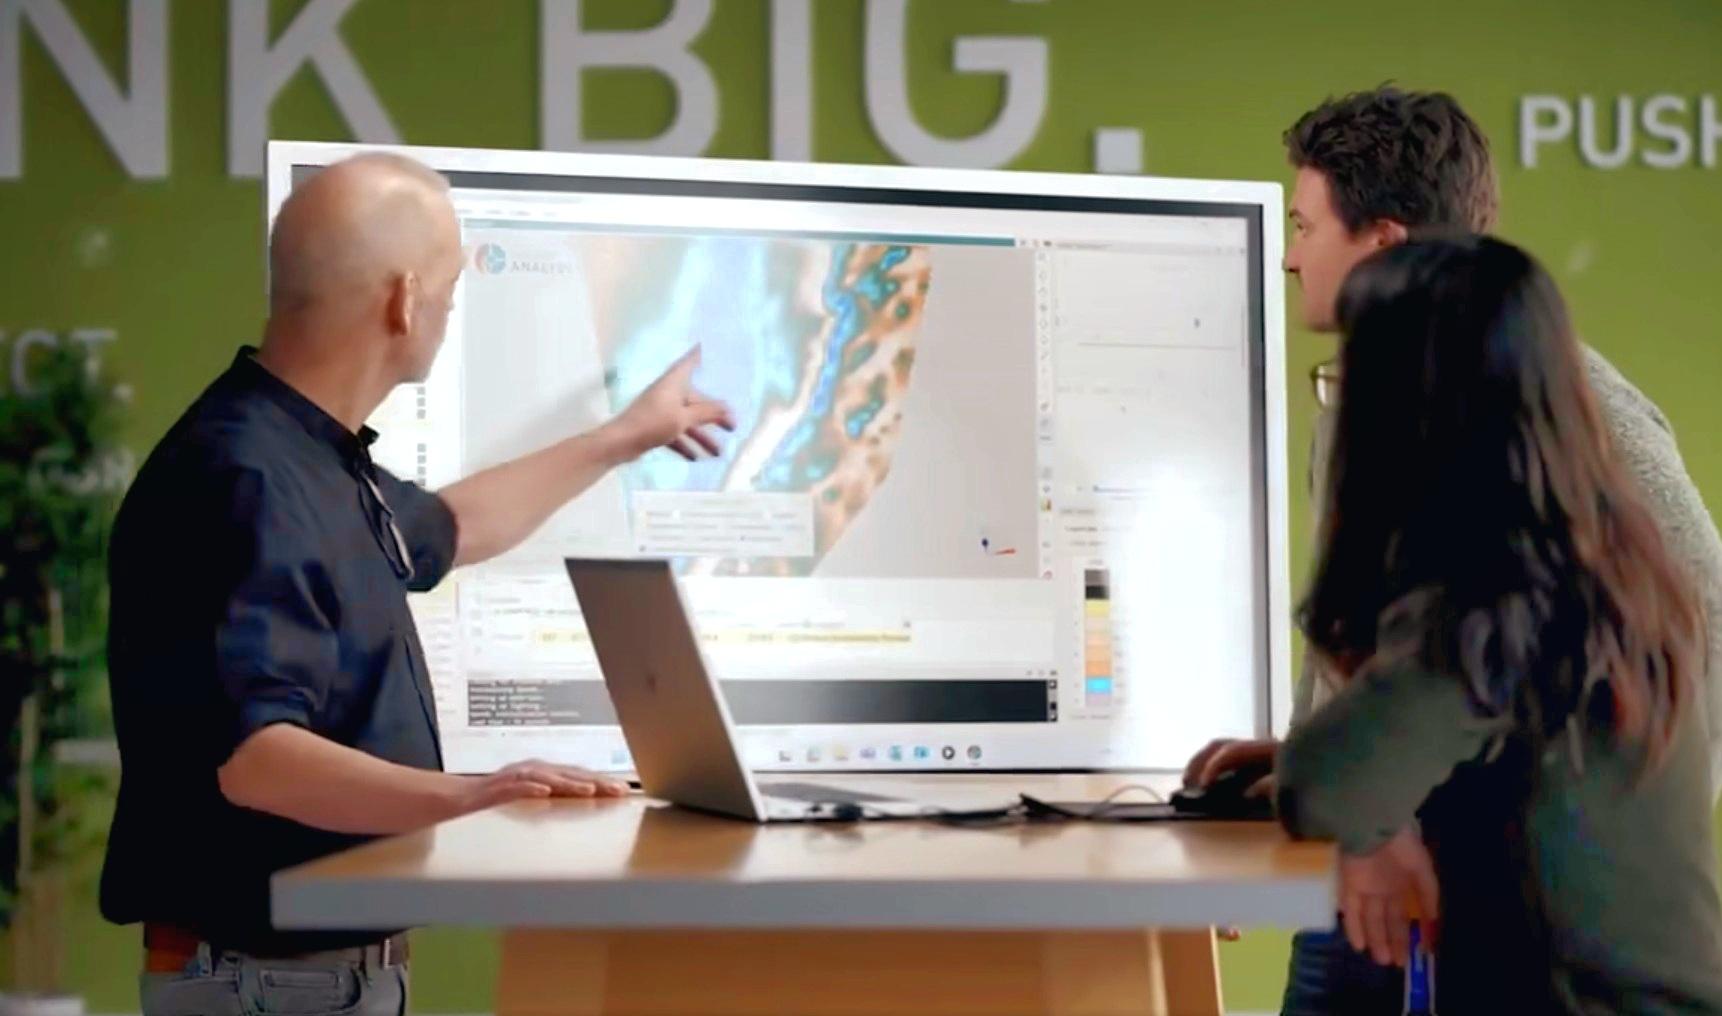
Revolutionizing Subsurface Interpretation and 3D Visualization with Geoscience ANALYST Pro
Discover how EnBW is bridging the gap between 2D mapping, 3D seismic interpretation, and integrated geophysical workflows

25 years modelling the earth together
Dedicated to driving technological innovation and excellence in the realm of geoscience. Your success is at the heart of everything we do.

Quick selection search tool
In Geoscience INTEGRATOR we added a search box to help you find objects lists such as drillholes, samples, or stations that often have thousands of items...

Imago drillhole imagery light table connection
In GOCAD, you can now connect to your Imago account by...

Bridging the gap
Industry uptake of academic exploration and mining research is often slower than it should be. Academics must focus on innovation and education...

Viewing data from report items
In Geoscience INTEGRATOR table and chart items from ad-hoc or scheduled reports can be easily refreshed, using the same filters that were applied in the original report, to display current data.