


Navigate through chapters:
SUMMARY
Targeting mineral deposits using machine learning is an increasingly common task in the mining industry. Machine learning targeting integrates multiple disciplines: geochemistry, geophysics, geology, statistics, and data science. This multidisciplinary approach presents challenges and requires close collaboration of experts from multiple disciplines. To demonstrate how machine learning can support regional exploration, we focus on southwestern British Columbia, particularly the area of Geoscience BC’s QUEST-South project. The area is underlain by the Cache Creek and Quesnellia terranes and the dataset covers notable active Cu-porphyry mines such as the Highland Valley Copper, New Afton and Copper Mountain mines, along with a number of interesting porphyry prospects. A consistent and comprehensive collection of datasets is available for the QUEST-South area, including rock geochemical assays, airborne gravity and magnetic surveys, providing a solid foundation for mineral exploration.
Geophysical data responses are related to both a broad lithological component and variations related to rock alteration; the latter of which is of more interest to the explorationist than the background lithological response. To separate these signals, we perform geologically and petrophysically constrained inversions of the potential field data to yield apparent density and apparent susceptibility anomaly maps. The constraining and anomaly separation processes allow the practitioner to isolate density and susceptibility anomalies relative to the geological unit in which they lie, and these anomalies are expected to better represent the mineralizing process than more simplistic inversion approaches. Constrained inversion requires the close cooperation of geophysicists and geologists in the modelling process and a flexible, interpretive and iterative approach. A similar approach can be applied to level geochemical data to the lithological domains to better isolate the geochemical anomalies of interest to the explorationist.
Once high-quality data inputs are generated, the machine learning targeting workflow can be started. In applying such a workflow to a mineral targeting scenario, several challenges arise: (1) spatial correlation, (2) imbalanced data, and (3) very few positive data points. These issues can lead to overfitting, especially during validation and parameter selection. We propose a workflow addressing each of these issues, thus improving the robustness of the predictions. Mitigating these data science and statistical challenges allows exploration geologists to confidently integrate machine learning into their everyday targeting tasks, resulting in more informed and accurate outcomes.
Project Location
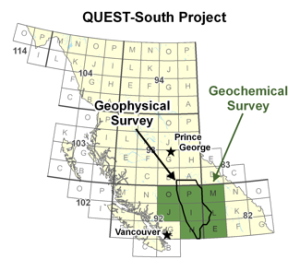
This study utilizes geophysical and geochemical datasets from the QUEST-South project (Geoscience BC, 2009), a geoscience initiative covering the southern Quesnel Terrane in British Columbia, Canada. The location of the project is presented on Figure 1. The geochemical dataset is further complemented by the regional compilation from the British Columbia Geological Survey (Hans, 2020).
Geophysical Data and Methodology
The QUEST-South project has complete magnetic and gravity data coverage with aeromagnetic, ground and airborne gravity surveys as shown in Figure 2.
The magnetic data consists of the Natural Resources Canada (NRCAN, 2024) 200 m aeromagnetic compilation. The residual magnetic intensity (RMI) of multiple surveys is merged and levelled to a common magnetic datum 305 m above ground.
The initial inversions are unconstrained and informed on spatial relationships between magnetic susceptibility, density and regional geology (Cui et al., 2019). These models contribute to the interpretation of a series of key petrophysical domains shown in Figure 3 (a).
These interpreted domains are further leveraged with constrained inversions, which have their initial model values defined by the computed per-domain means of the unconstrained models. The resulting constrained apparent magnetic susceptibility and density models are shown in Figure 3 (b) and (c) with their anomalous values i.e. the difference between the constraining model starting value and the resulting value after inversion.
We propose that the magnetic susceptibility and density anomalies derived in this way may be more closely related to alteration than the absolute value of magnetic susceptibility and density in either constrained or unconstrained inversions.


The ground gravity data comprises the Natural Resources Canada (NRCAN, 2024) gravity compilation. Gravity data presents a variable station distribution over the project area, is fully processed to free air, complete Bouguer and isostatic corrected data, and interpolated onto 2 km resolution grids.
The QUEST-South airborne gravity survey (Geoscience BC, 2009) was flown in 2009 with a fixed-wing aircraft along 2 km spaced E-W oriented flight lines. The terrain clearance was defined by a pre-planned drape surface designed to guide the aircraft over the topography in a consistent manner as close to target clearance as possible. The achieved mean terrain clearance is 658.8 m.
A key component of this work is the focus on the petrophysical characteristics of the lithologies found within the project area and to use these properties to build a petrophysically-based geological model. Geophysical inversions of the magnetic and gravity data are thus implemented to generate physical rock property models of magnetic susceptibility and density. Given the scale of the project area the inversion approach is simplified to models producing apparent magnetic susceptibility and density models.
Geochemical Data and Methodology
Geochemical rock analysis compilations from the British Columbia Geological Survey (Hans, 2020) have been extracted and compiled, with only the most recent values retained.

The geochemical values have been interpolated using geophysical data as secondary inputs. The interpolation method is a “Neural Inverse Distance Weighting” approach, illustrated on Figure 4 which trains a rotation matrix based on the distances between points and then assigns weights according to trainable range and nugget parameters.
The data is first standardized using the Centered Log-Ratio (CLR) transformation (Aitchison, 1986) to ensure compositional coherence and comparability. Then, the transformed values are interpolated and projected onto the geophysical data grid.

Training Targets
To define the training targets, we consider the existing economic porphyry copper deposits in the area: Highland Valley and Brenda (calc-alkalic porphyries), New Afton and Copper Mountain (alkalic porphyries). The British Columbia Geological Survey (2024) MINFILE occurence data around these deposits were used to delineate the “targeting areas” surrounding them. Those areas are presented on Figure 6.

Targeting
Machine learning consists of statistical models that aim to define relationships within a dataset and apply them to new, unseen data. However, in the context of mineral targeting, the ability to infer these relationships is limited by high variability in geological setting and data availability across regions. Therefore, the primary expectations for machine learning in mineral targeting should be (1) identifying correlations within the training dataset and (2) projecting those correlations on a map.
Mineral targeting datasets present statistical challenges that can lead to overfitting or other biases. The issues include (1) spatial correlation, (2) highly imbalanced positive targets, and (3) the presence of inherent false negatives in the dataset. To address these challenges, we apply the following strategies:
- Regional Data Partitioning: The dataset is divided into geographical regions, as presented in Figure 6, with each deposit area considered separately. One region is designated for testing, while the others are used for training and cross-validation to determine optimal model parameters.
- Handling Imbalanced Data: We use an Imbalanced Random Forest, presented in Figure 7, to mitigate the issue of highly imbalanced classes (Lemaitre et al., 2017). This implementation is particularly robust for such datasets, as each tree in the random forest is trained on a different balanced subset, randomly selected from the original data.
- A major cause of overfitting is the improper selection of input properties. To address this, we used the Optuna algorithm (Akiba et al., 2019), which integrates hyperparameter tuning directly into the training process. To determine which properties to include or exclude, we define the activation of each property as an input parameter (0 or 1) and allow the model to converge, as illustrated in Figure 8. This results in the automatic selection of relevant properties based on the training dataset.


This approach effectively eliminates properties that introduce bias or provide little value for model training. However, some properties can lead to overfitting because they are naturally correlated with the target variable (e.g., copper concentration when predicting copper deposits). These can obscure other meaningful and sought-after relationships. A geologist must manually discard such properties using domain knowledge to ensure a balanced and interpretable model.
Results
To train the model, we use Copper Mountain positive targets (and surrounding negatives) as the training set. All points within a 70 km radius around the nearest deposits are selected as training points. To evaluate the impact of different input data on model performance, we conducted three separate training experiments using different datasets, as presented in the Figure 9. The first dataset contained only geophysical data, allowing us to assess the predictive power of geophysical properties alone. The second dataset combined geophysical and geochemical data, excluding known Cu pathfinder elements, to test whether general geochemical trends contribute to mineral prediction. The third dataset incorporated all available data, including geophysical properties, geochemical elements, and Cu pathfinder elements, to examine the full extent of predictive capability.

The model performance presented on Figure 10 was evaluated using confusion matrices and ROC curves for each dataset. The confusion matrices illustrate the proportion of correctly and incorrectly classified points, highlighting differences in predictive accuracy between datasets. The geophysics-only model showed the lowest performance, with higher false positives and lower recall. Adding general geochemistry improved the model, reducing misclassifications, while the full dataset, including Cu pathfinder elements, achieved the best performance with an accuracy of 81 %.

The feature importance analysis, shown in Figure 11, provides insights into which properties contribute most to the model’s predictions across different datasets. In the geophysics-only model, the most predictive property is the total horizontal derivative of the 5,000 m upward continuation of the residual magnetic intensity; mag_RMI_UC_05000m_THD, highlighting the influence of geophysical trends in mineral targeting. When geochemical data is added, the model begins to utilize Scandium (Sc) alongside geophysical features such as first vertical derivative (1VD) and total horizontal derivative (THD) of the 5,000 m upward continuation of the residual magnetic intensity; mag_RMI_UC_05000m, indicating that certain geochemical elements enhance predictive performance. Finally, when Cu pathfinder elements are included, the model predominantly relies on Copper (Cu), reflecting its direct correlation with mineralization.

The Figure 12 illustrates how different datasets contribute to mineral prospectivity predictions and highlights areas where multiple correlations converge. Each model—trained on geophysics only, geophysics + geochemistry, and geophysics + geochemistry + Cu pathfinders—produces a distinct probability map, emphasizing different correlations between the known mines and the input properties. By combining predictions above 50 % probability from all three models, the final map identifies regions that are consistently highlighted as prospective across multiple datasets. This approach strengthens confidence in the results, as overlapping predictions suggest areas where different geophysical and geochemical correlations align, reinforcing their significance for exploration targeting.


Conclusions
This study demonstrates how machine learning techniques, combined with geophysical and geochemical datasets, can enhance mineral exploration targeting in the southern Quesnel Terrane. By leveraging publicly available data in the QUEST-South project area, the study successfully identified new prospective areas while validating known deposits.
Key findings include:
- The robust magnetic susceptibility and density models generated from constrained inversions that leverage interpreted petrophysical domains,
- The successful interpolation of geochemical values using geophysical data as secondary inputs,
- Three machine learning models, demonstrating strong predictive capabilities,
- The delineation of several potential targets, including anomalies in the north of the area, and trends in the continuity of the Copper Mountain deposit.
A crucial aspect of this study is proper data preparation, extracting meaningful information from geophysical surveys and interpolating geochemical values using geophysically based models. Moreover, by integrating structured data preparation, balanced training, rigorous spatial validation, and automatic properties selection this study provides a reliable framework for mineral prospectivity modelling.

References
Aitchison, J., 1986. The Statistical Analysis of Compositional Data, Monographs on Statistics and Applied Probability. Chapman & Hall Ltd., London (UK). 416p.
Akiba T., Sano, S., Yanase, T., Ohta, T., and Koyama, M., 2019. Optuna: A Next-generation Hyperparameter Optimization Framework. In Proceedings of the 25th ACM SIGKDD International Conference on Knowledge Discovery & Data Mining, Anchorage, AK, USA, 4–8 August 2019; pp. 2623–2631.
Cui, Y., Miller, D., Schiarizza, P., and Diakow, L.J., 2017. British Columbia Geological Survey, British Columbia digital geology. British Columbia Ministry of Energy, Mines and Petroleum Resources, British Columbia Geological Survey Open File 2017-8, 9p. Data version 2019-12-19.
British Columbia Geological Survey (BCGS), 2024. MINFILE: Mineral Occurrence Database, https://catalogue.data.gov.bc.ca/dataset/minfile-mineral-occurrence-database.
Han, T. and Rukhlov, A.S., 2020. Update of the provincial Regional Geochemical Survey (RGS) database at the British Columbia Geological Survey. British Columbia Ministry of Energy, Mines and Petroleum Resources, British Columbia Geological Survey GeoFile 2020-08, 3p.
Geoscience BC, Sander Geophysics Ltd., Jackaman W., 2009. QUEST-South project. Noble Exploration Services Ltd., Sander Geophysics Ltd. Project ID(s): 2009-QS002, 2009-QS003, 2009-QS004, https://geosciencebc.com/major-projects/quest-south/.
Lemaître, G., Nogueira, F., & Aridas, C. K., 2017. Imbalanced-learn: A Python toolbox to tackle the curse of imbalanced datasets in machine learning. Journal of Machine Learning Research, vol. 18, number. 17, pages 1-5, http://jmlr.org/papers/v18/16-365.html.
Natural Resources Canada (NRCAN), 2024. Aeromagnetic, Airborne Electromagnetic, Gravity and Radiometric Survey Compilation Data, Canadian Airborne Geophysical Data Base, Airborne Geophysics Section, Geological Survey of Canada, Lands and Minerals Sector.
Access the Project File
Fill out the form to receive the project file via email. This file is fully compatible with Geoscience ANALYST 3D viewer and includes all public data, objects, and pre-set views—ready to explore.
Don’t have Geoscience ANALYST 3D viewer yet?
Download it for free anytime from our website!
Meet the authors

Matthieu Cedou, PhD, P.Eng.
Machine Learning Engineer, Mira Geoscience

Thomas Campagne, P.Geo.
Senior Geophysicist, Mira Geoscience

Scott Napier, M.Sc. P.Geo.
Global Director—Consulting, Mira Geoscience

Gem Midgley, MEconGeol
Principal Consultant, Mira Geoscience
Latest news

Chasing Innovation from the Ground Up

Q&A with VR Resources

GEOH5: A Framework for Geoscience Data and Model Portability

New release – Geoscience ANALYST 4.5

View neighbourhoods in 3D

Improved scatter plots

New importer: 2D SEG-Y

Bounding boxes in the viewer

Themes

UDMN Award of Excellence

Georeference images
