Coffee break… and learn!
Available on our YouTube channel
In this lecture, Shaun O’Connor showed how to get started with moving drillhole data between Geoscience ANALYST and Python using the geoh5py library. This demonstration included creating a pandas dataframe from a drillhole log in Geoscience ANALYST, analyzing and interpreting the data using Python tools, and exporting the results back to Geoscience ANALYST for visualization in 3D.
Episodes become available on our YouTube channel. More details about this series can be found on our Events page or join the mailing list.

Shaun is an exploration geologist with 10 years of experience in exploration and mineral systems modelling for gold, base metals, lithium, and industrial minerals in varied geological environments, including Cordilleran arcs and intrusions, Archean greenstone belts, and bimodal volcanic systems. Before joining us, Shaun leveraged his strong geological field experience, software expertise, and talent for modelling and research to help unlock the value of geological data and revolutionize exploration frameworks for clients ranging from independent prospectors to top gold producers worldwide. Shaun obtained his MSc in geological sciences from Queen’s University and is based in Halifax, Canada.
Latest events and news

Editing property transparency
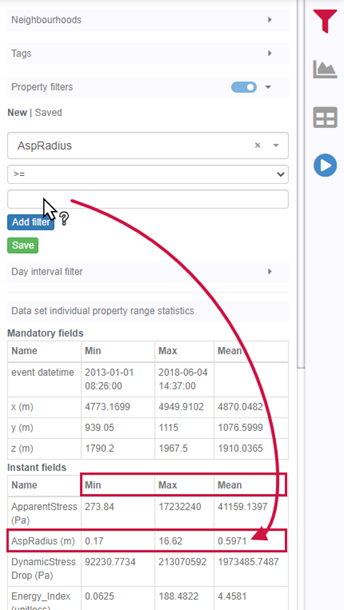
Property value range

Create regions – Crossplot 2D

HiveMap Digital Mapping Software

UDMN Award of Excellence

Documents linked to a project

New filter options on the File manager and the Maps/plans/sections

Organizing files as data sets

Getting started with the Python geoh5py

No-data values on import templates

Upload global descriptions