


Table and chart items from ad-hoc or scheduled reports can be easily refreshed, using the same filters that were applied in the original report, to display current data.
Items count > Chart, Table, or Chart and Table Name > Apply changes.

You can also modify the filters and run the query again without modifying the items captured in the reports.
Previous tips can be found under the Software tip category in the News section and in the Archives section of our website.
Latest news

Québec Mining 2024
Explore the full interview that Scott Napier did for Québec Mining 2024

Digital Mapping, The Future!
Capture geological observations quickly, safely, and accurately, both in the field and office with HiveMap...

Bridging the gap
Industry uptake of academic exploration and mining research is often slower than it should be. Academics must focus on innovation and education...

Meet Polyanna Rowe, PhD
This release includes enhancements to several existing importers and exporters for extended interoperability, and more...

Customized list of file types to help filtering your files
In Geoscience INTEGRATOR, on top of using Tags and Data set linking, you can give them a File type from a customizable list...

Easily display a property on multiple objects
In GOCAD Mining Suite objects are grouped by the properties they contain...

Using ioGAS in Geoscience ANALYST Pro – Virtual Lecture
Past event, recording available here...

Deep Learning as an alternative to downward continuation filters for structural interpretation
Jean-Philippe Paiement proposes an alternative approach to the commonly used downward continuation filters used in the industry...

Georeference images
In Geoscience ANALYST Pro you can georeference your geology maps and cross sections with...

Uploading multiple files
In Geoscience INTEGRATOR, you can upload multiple files in one simple step...
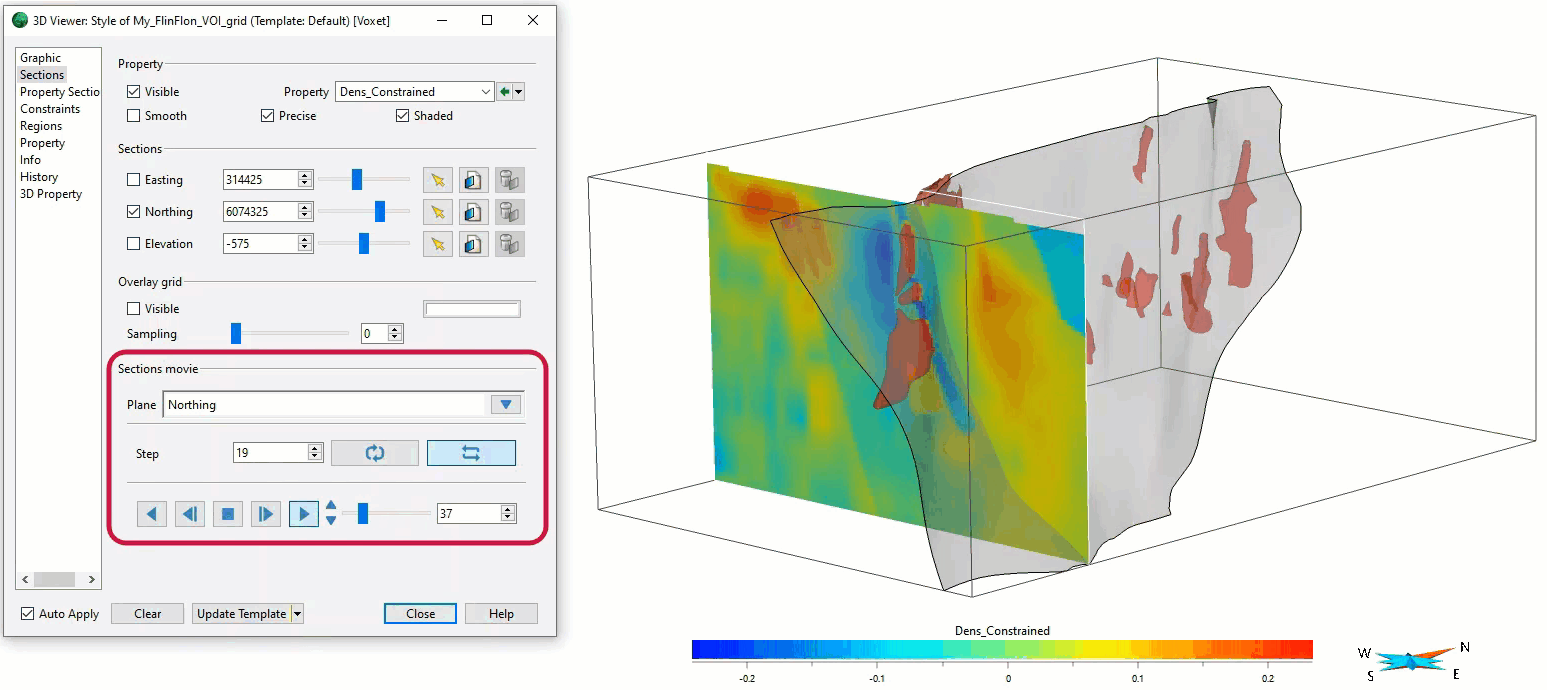
Sections movies
In GOCAD Mining Suite, you can create a section animation by specifying which section plane you want to visualize...
