


Last month’s Virtual Lecture showed how to maximize displaying drillhole data in Geoscience ANALYST free Viewer. While pencil crayons are still a vital part of geology, Geoscience ANALYST lets you get all your data into 3D in a convenient shareable format.

Previous tips can be found under the Software tip category in our News page and in our Archives page. Join our Virtual Lecture series that showcases technological advancements and provides quick tutorials on Geoscience ANALYST features. More details about this series on our Events page or sign-up to the mailing list.
Latest news

Editing property’s colormap
In GOCAD Mining Suite, when you select a property its colormap can be edited...

Manual classifications vs Project classifications
In Geoscience INTEGRATOR, There are two ways to create classifications when importing data...
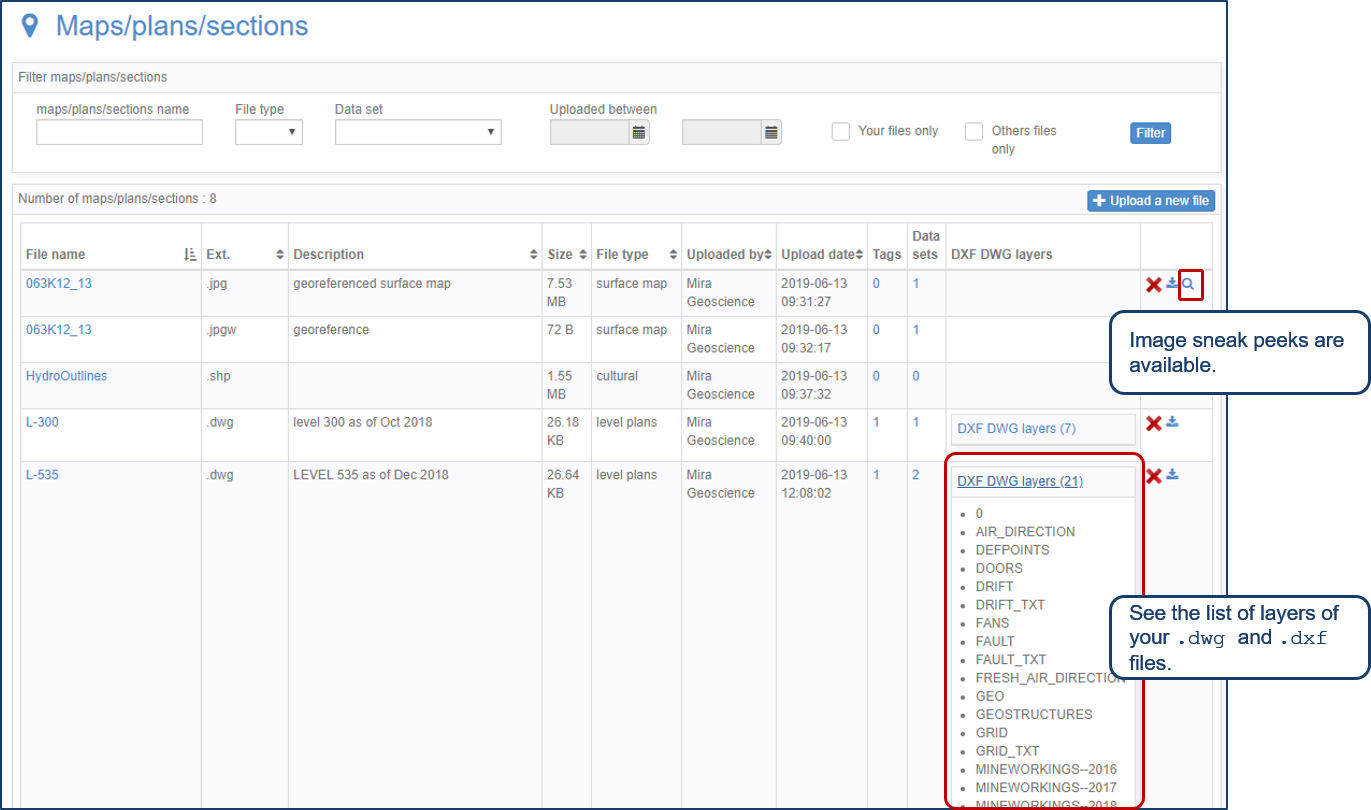
Preview files in the Maps/plans/sections page
See the list of layers of your .dwg and .dxf files. Image sneak peeks are also available...

Create regions – Crossplot 2D
In GOCAD Mining Suite you can filter data dynamically before creating regions and save the filters as templates for later use...

Organizing files as data sets
In Geoscience INTEGRATOR, a data set is often composed of a group of files of various formats along with metadata. These can be grouped...

Operations on multiple files
In Geoscience INTEGRATOR, you can carry out various operations on multiple files simultaneously...

Block model volume
In Geoscience ANALYST you can visualize your block model data by volume in the Visual Parameters panel...
..

Default data colour settings
In Geoscience ANALYST you can set a default colour table and colour mapping transformation function. This way, when you import or create new data, it will be coloured by default.
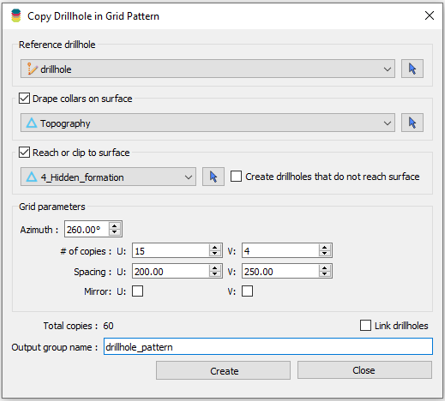
Copying drillholes in a grid pattern
In Geoscience ANALYST you can copy an existing drillhole’s collar and deviation in a grid pattern to map a mineralized horizon...