New release – Geoscience INTEGRATOR 4.1
Geoscience INTEGRATOR 4.1 unveils a range of new features and improvements designed to boost performance and enhance user experience.


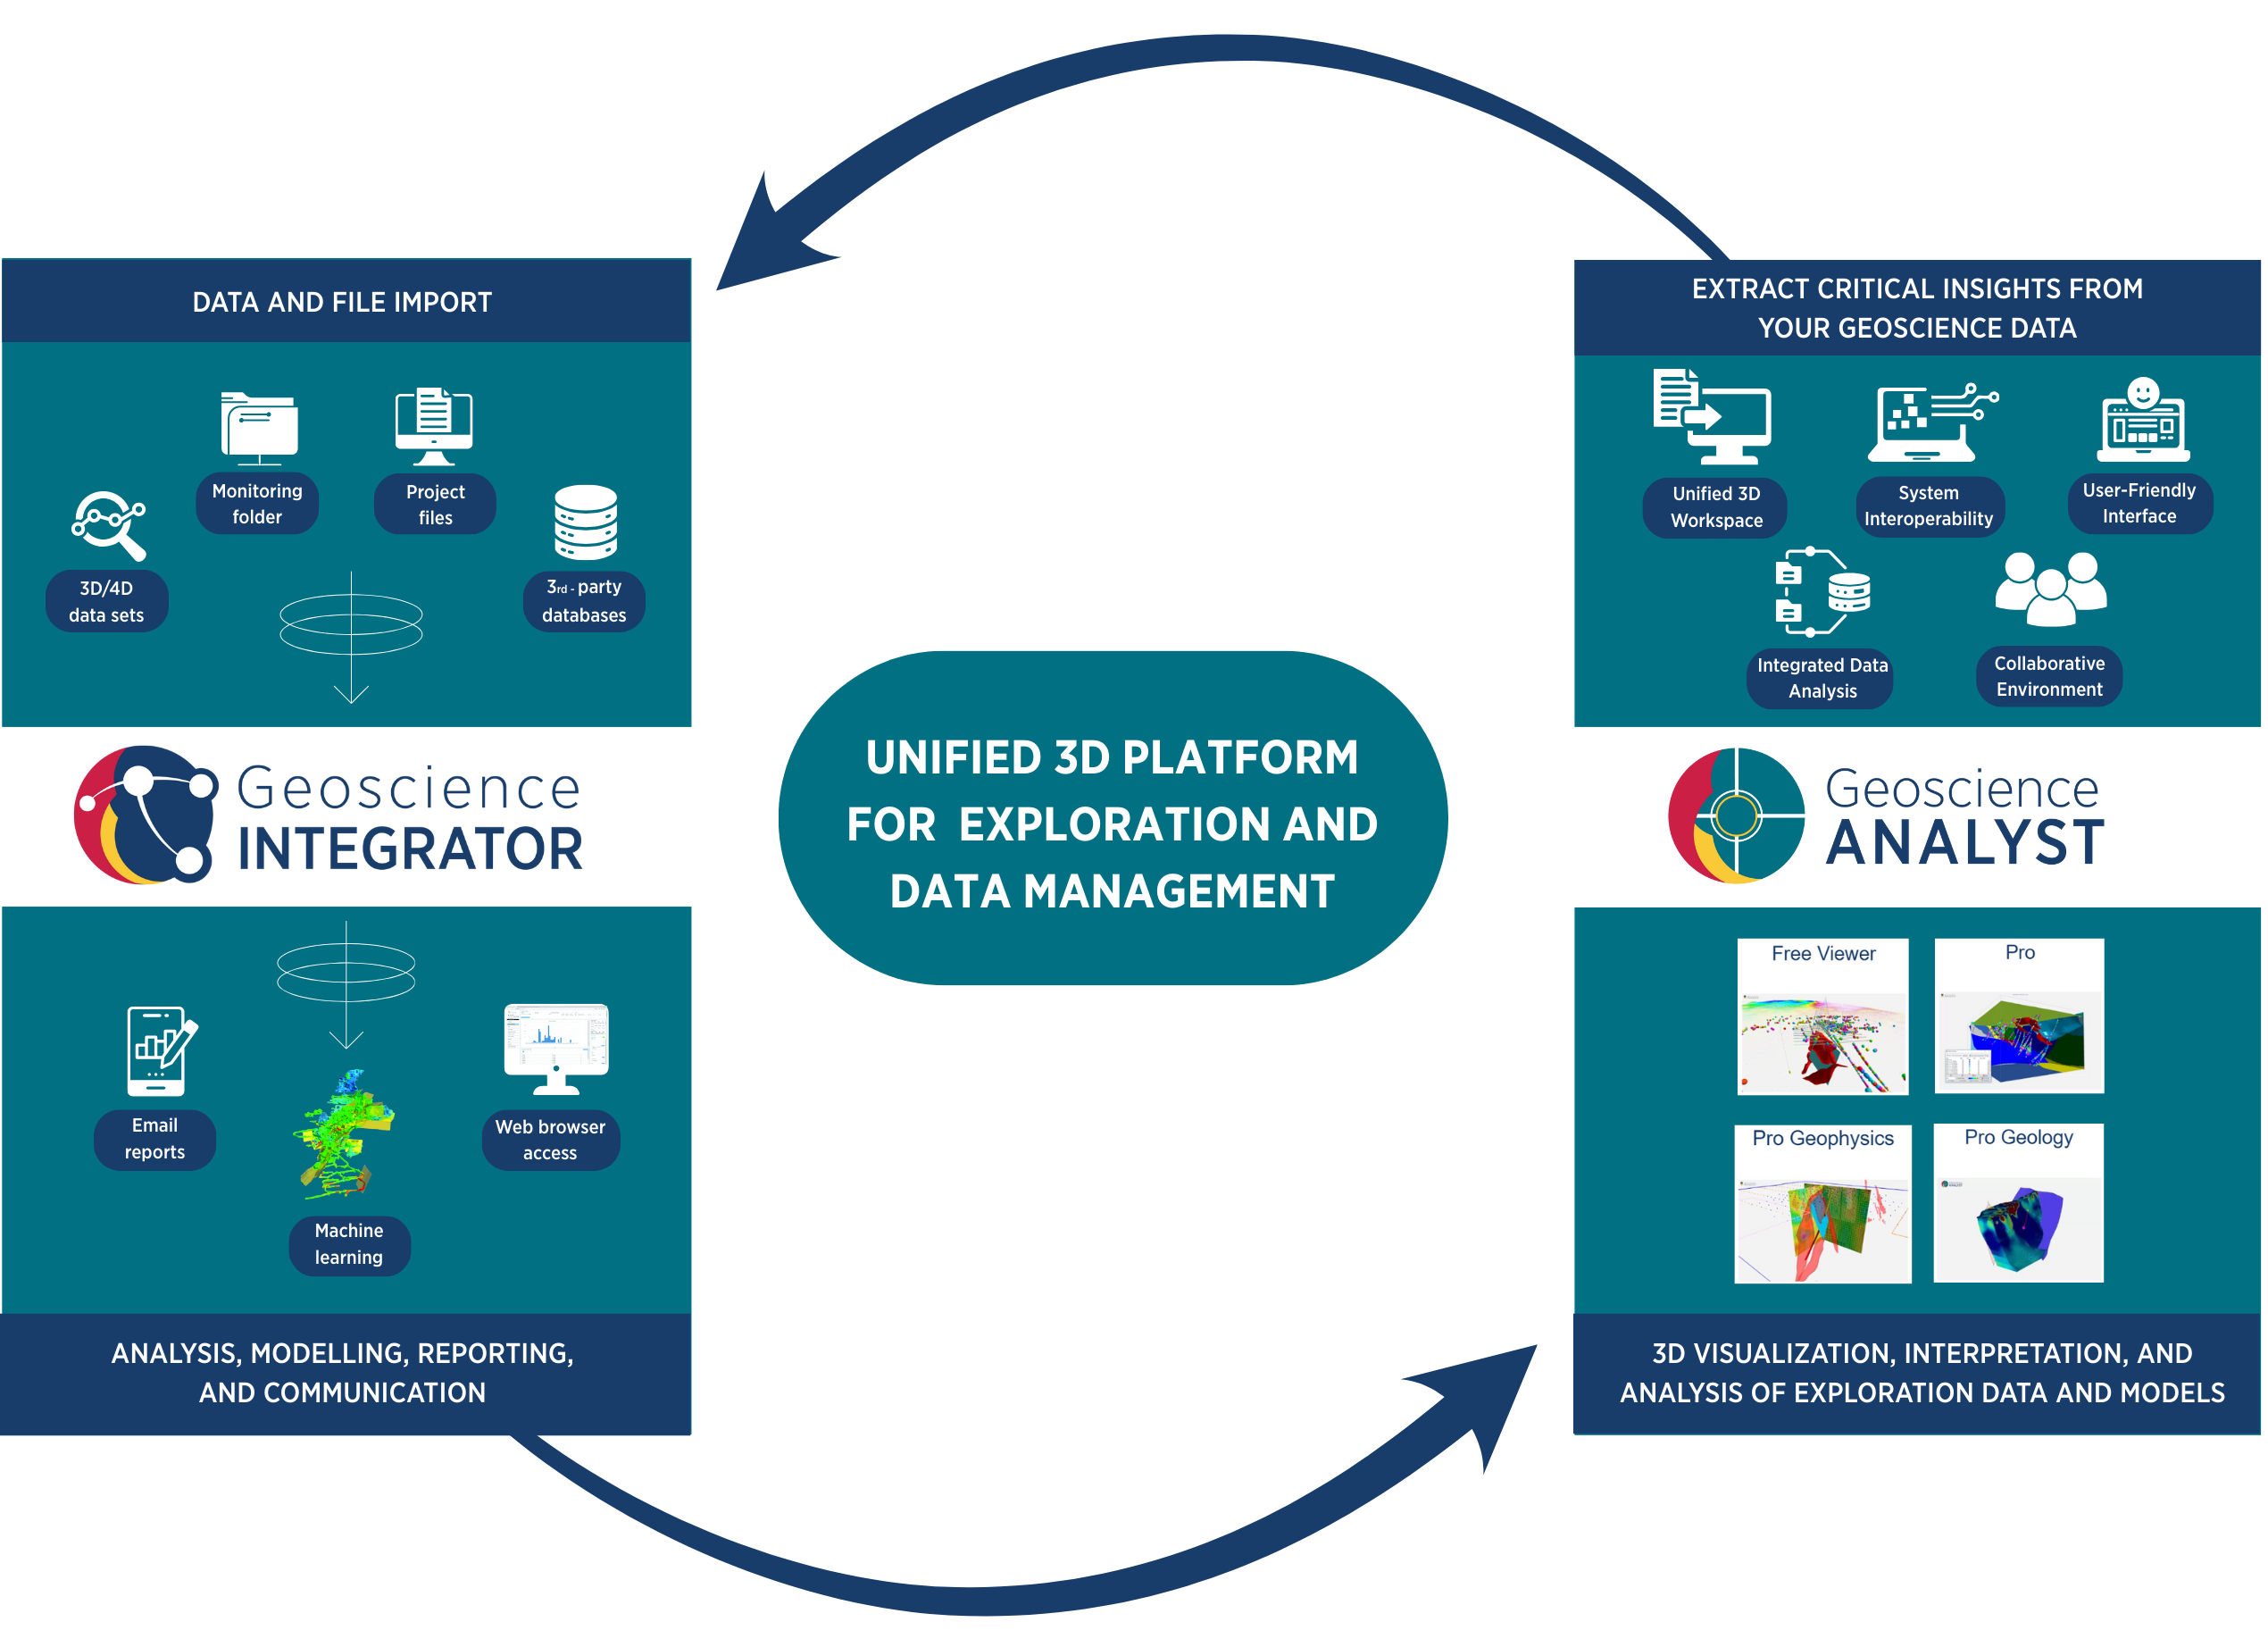
Geoscience INTEGRATOR provides advanced data fusion capabilities designed to address mining industry challenges. It maintains 3D earth model and 4D mine model geometrical data structures, onto which multiple datasets can be projected, interpolated, upscaled, downscaled, or otherwise processed according to data type. This ensures that key variables are co-located in both space and time—a prerequisite for applying advanced analytics and machine learning.
Seamless integration with Geoscience ANALYST establishes a strong quantitative and visual connection between data and models, while embedded Business Intelligence (BI) functionality delivers interactive charts, tables, and configurable data views. Standard import tools can be extended with customized connections to any data source, including real-time feeds, supporting both exploration and operational workflows.

”With Geoscience INTEGRATOR acting as a searchable 4D database, users can query by time as well as spatial criteria. You can ask it to show all data from the past five years or look specifically for legacy datasets, along with common category search functions. That’s a game-changer for discovery workflows.
—Gem Midgley, Principal Consultant at Mira Geoscience

Each Geoscience INTEGRATOR server supports multiple exploration projects and mine sites, with access for an unlimited number of users through both a web interface and Geoscience ANALYST. Users can interactively explore data in 2D, 3D, and 4D using spatial, temporal, and attribute-based queries. Historical data can be readily discovered, visualized, and downloaded for further use.
Data fusion is essential for applying machine learning in mining and exploration. For example, rockburst hazard depends on geology, stress, production factors, rock mass quality, seismicity, and other variables—yet engineers have traditionally lacked tools to quantitatively integrate them.


Hazard assessment can run on demand or on a set schedule, typically triggered by new data imports. For example, if seismicity data is ingested daily and the mine model updated, hazard assessments are refreshed at the same frequency.
The approach is proven across multiple mine types (open pit, underground, hard rock, soft rock) and hazards (for example: rockburst, roof fall, slope failure, inflow). Hazards are modeled as 4D functions of time and space at rock interfaces, drawing on dozens of variables compiled through Geoscience INTEGRATOR’s data fusion. Machine learning analyzes mine history against hazard events to define rigorous, data-driven hazard equations.
Powered by a scriptable run-time engine on the Geoscience INTEGRATOR server.
Supports advanced computations: onboard microseismic processing, kinematic bench analysis, 3D interpolation of structural data.
Embedded Business Intelligence tools deliver charts, tables, and data views directly in the web browser. Reports can combine most visualizations into customizable PDFs for ad hoc or scheduled delivery. The 3D visualizer (Geoscience ANALYST) links 2D, 3D, tabular, and statistical displays for integrated analysis.
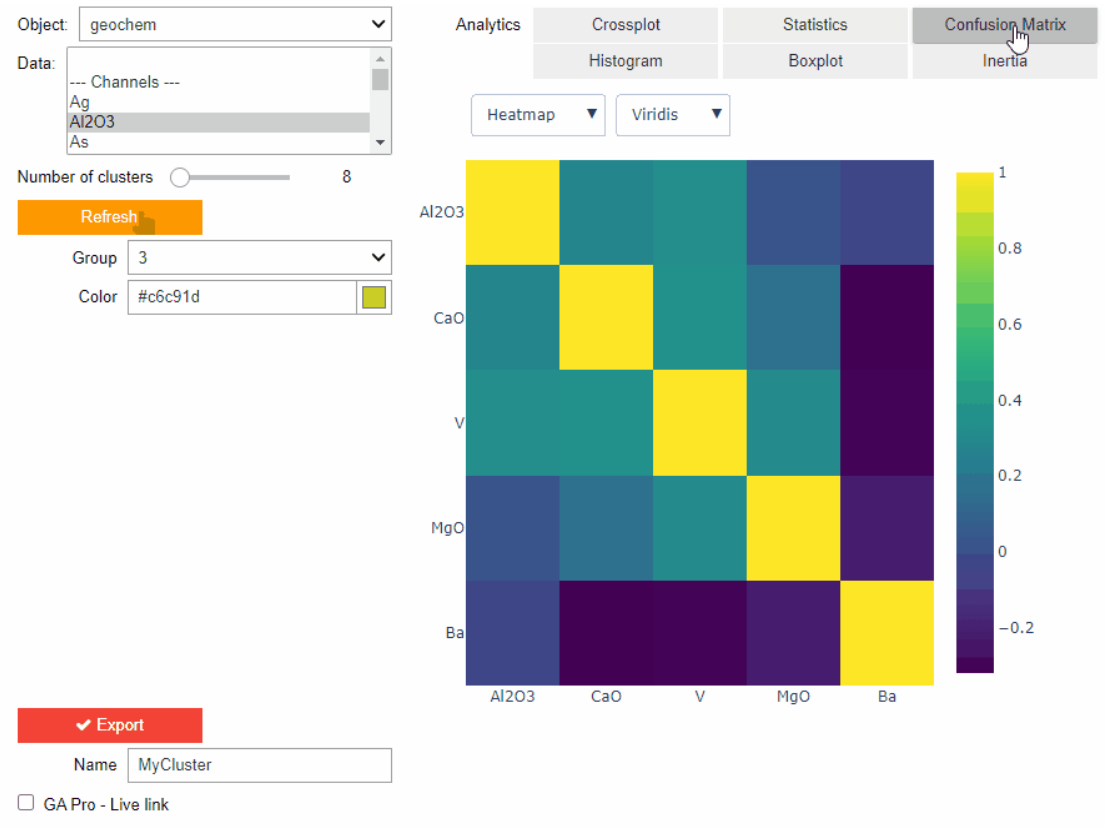
Generate histograms, scatter plots, ternary diagrams, and time series.
Control plotting: linear/log scales, point scaling, coloring by property, tooltips.
Apply query filters for precise record selection across plots and tables.
View “mine model” data fusion tables and 2D map plots, selectable by elevation and property colouring.
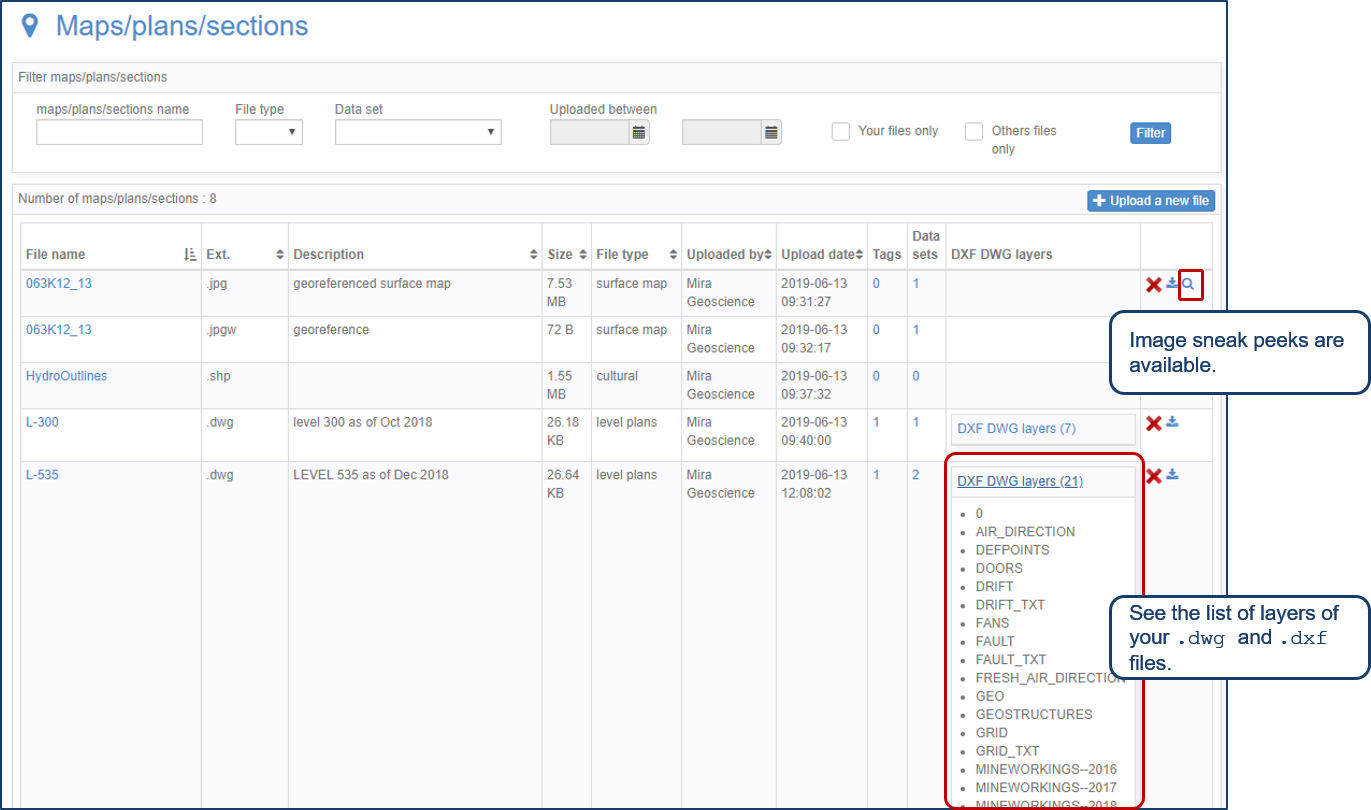
Export tables to CSV.
Save chart and table views with plotting parameters and filters for later viewing with updated data.
Insert charts, tables, and mine model views into customizable PDF reports.
Generate reports on demand or schedule automatic distribution to defined email groups.
Display linked 2D, 3D, tabular, and statistical views of the Geoscience INTEGRATOR database in Geoscience ANALYST.
Navigate spatial models while dynamically updating associated tables and plots.
Integrate geological, geotechnical, and geophysical datasets in a single environment.


Geoscience INTEGRATOR + Geoscience ANALYST offers a powerful integrated 3D platform to unlock the full potential of your data, streamline workflows, and enhance multi-disciplinary collaboration. All while keeping your software spend under control.