M S 1154 September 6, 2021 Customize the Viewport axis labels In Geoscience ANALYST you can customize the Viewport axis labels ..Read More
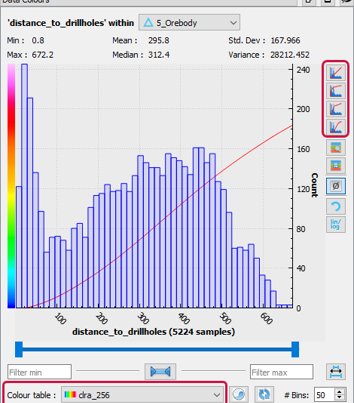
M S 1154 August 1, 2021 Data display precision In Geoscience ANALYST Data Colours panel you can control the precision of the data...Read More
M S 1154 July 1, 2021 Scripting In Geoscience ANALYST Pro the Script on Object Property utility in Geoscience ANALYST Pro can…Read More
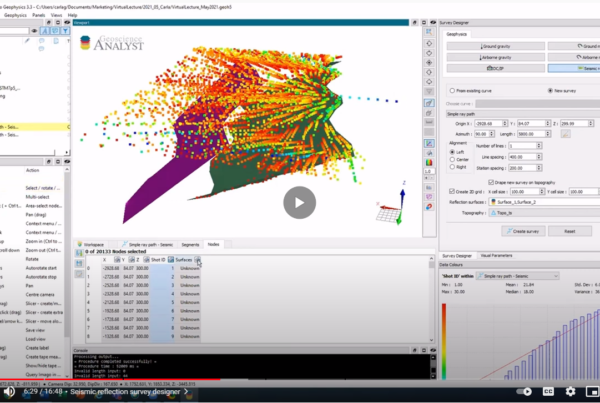
M S 1154 June 2, 2021 3D seismic data In Geoscience ANALYST you can import and visualize 3D seismic data, and plan your next…Read More
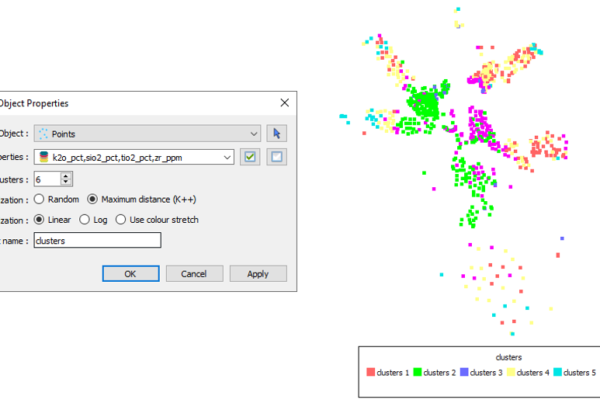
M S 1154 May 6, 2021 K-means clustering In Geoscience ANALYST Pro’s v3.3, you can quickly partition your data based on the K-means…Read More
M S 1154 March 31, 2021 15 tips in 15 minutes 15 Geoscience ANALYST tips on advanced visualization and knowledge sharing...Read More
M S 1154 March 8, 2021 Python API live link In Geoscience ANALYST you can enable a monitoring directory to instantly visualize and analyze the…Read More
M S 1154 February 1, 2021 Show and hide In Geoscience ANALYST you can show and hide everything, individual objects, container groups or drillhole…Read More
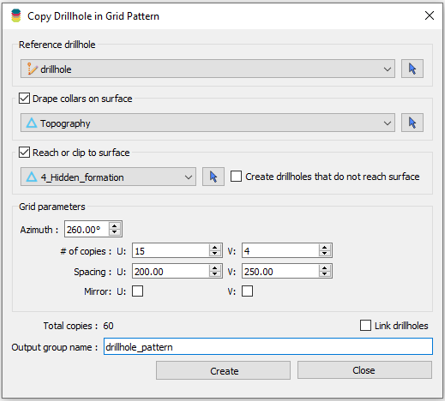
M S 1154 January 5, 2021 Copying drillholes in a grid pattern In Geoscience ANALYST you can copy an existing drillhole’s collar and deviation in a grid…Read More
M S 1154 December 7, 2020 Automatic rotation In Geoscience ANALYST you can autorotate viewport when presenting your 3D geoscientific data and models...Read More
M S 1154 November 9, 2020 Default data colour settings In Geoscience ANALYST you can set a default colour table and colour mapping transformation function.…Read More
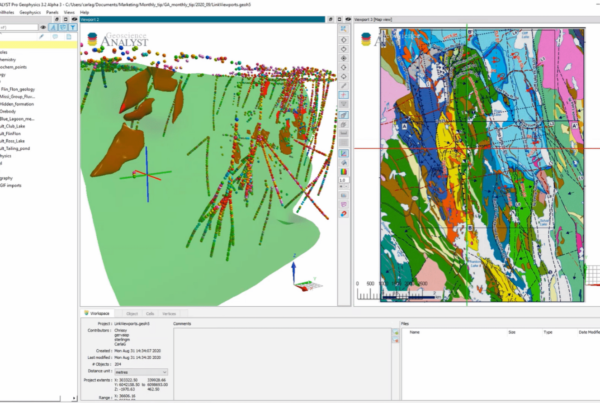
M S 1154 October 5, 2020 Linking cursors In Geoscience ANALYST you can use the Link Cursors button to helps to track the…Read More