


Table and chart items from ad-hoc or scheduled reports can be easily refreshed, using the same filters that were applied in the original report, to display current data.
Items count > Chart, Table, or Chart and Table Name > Apply changes.

You can also modify the filters and run the query again without modifying the items captured in the reports.
Previous tips can be found under the Software tip category in the News section and in the Archives section of our website.
Latest news
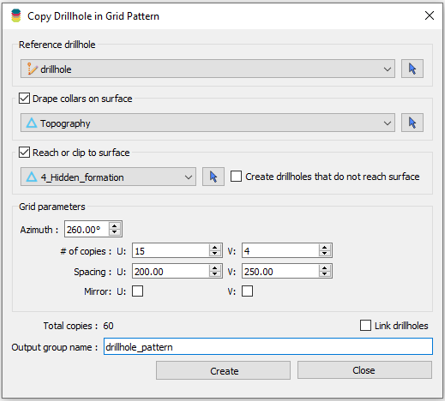
Copying drillholes in a grid pattern
In Geoscience ANALYST you can copy an existing drillhole’s collar and deviation in a grid pattern to map a mineralized horizon...

Inverting time domain data in Geoscience ANALYST version 4.0 – Virtual Lecture
Kristofer inverts TEM data in 1D through Geoscience ANALYST Pro Geophysics to recover conductivity in Geoscience ANALYST 4.0...

Display multiple Voxet sections
In GOCAD Mining Suite, you can create additional sections, hide/show them, use the slider and arrow to position them along the Voxet, and delete them...

Creating properties within the script editor
In GOCAD, properties can be created within the Property Script Editor by typing the new property name in the script and then clicking Define Variables…

Used v/s available themes
In Geoscience INTEGRATOR, the Theme drop down menu shows a filtered list of those containing data sets by default...

Extracting property names from a CSV
In Geoscience INTEGRATOR, extract the property names directly from a CSV file to speed up the process and reduce errors...

Rock reclassification editor
In GOCAD Mining Suite, you can simplify logging codes for modelling projects and data management using the Rock reclassification editor...

Coal industry solutions
Our coal solution provides users the simplicity of 2D grid modelling with the geological complexity of 3D volumetric surface modelling...

Q&A Irish Centre for Research in Applied Geosciences
We had a chat with Dr. Roisin Kyne from Teck Resources and Dr. Koen Torremans from iCRAG about the importance of 3D analysis and modelling...

A robust workflow for regional porphyry targeting; Application to the QUEST-South project area in southern British Columbia
Mitigating data science and statistical challenges is crucial to integrate machine learning into the everyday targeting tasks of exploration geologists.

Tabular property viewer
In GOCAD Mining Suite you can view your object’s properties in a tabular format with the Tabular Property Viewer...
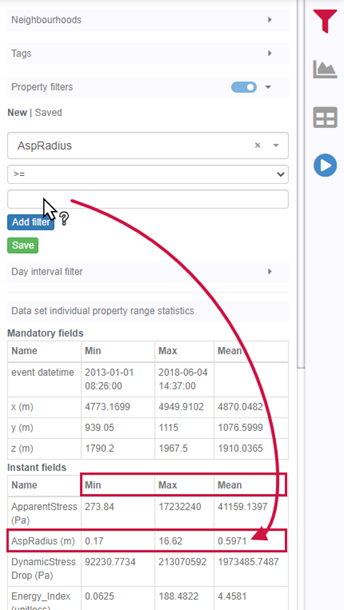
Property value range
In Geoscience INTEGRATOR, You can refer to the range of values in the query panel to apply numeric property filters...